Tümay Turhan

I start with the problem then build toward a useful solution.

Researcher, builder, systems thinker: I build data and AI systems that make complex information easier to use.

SQL, Python, BI dashboards, machine learning and LLM/RAG systems — shaped through hands-on projects across analytics and AI.

About

I enjoy working with data. In every role I’ve had, I found myself drawn to the analytical side — making sense of numbers, building reports and figuring out what’s actually going on beneath the surface.

Over time, I realized this is where I do my best work: understanding data, finding patterns and turning complexity into something clear. I like clear thinking, honest signals and making things easier to understand.

Outside of work, I’m curious by default. History, philosophy, anthropology, video games — I’m drawn to how systems work and what drives people. I also like sharing what I learn. Writing, explaining and making complex things simpler is part of the process for me.

Structured, analytical and honest—that's how I think and how I work.

Domains

What I focus on

Data Analysis

Making sense of data and turning it into clear insights.

Business Analysis

Understanding problems, processes, and what actually needs to improve.

Machine Learning

Building simple models to explore patterns, predictions, and practical use cases.

Applied AI

Working with LLMs, RAG and AI workflows to make information easier to use.

Product Thinking

Designing small, useful tools that people can actually understand and use.
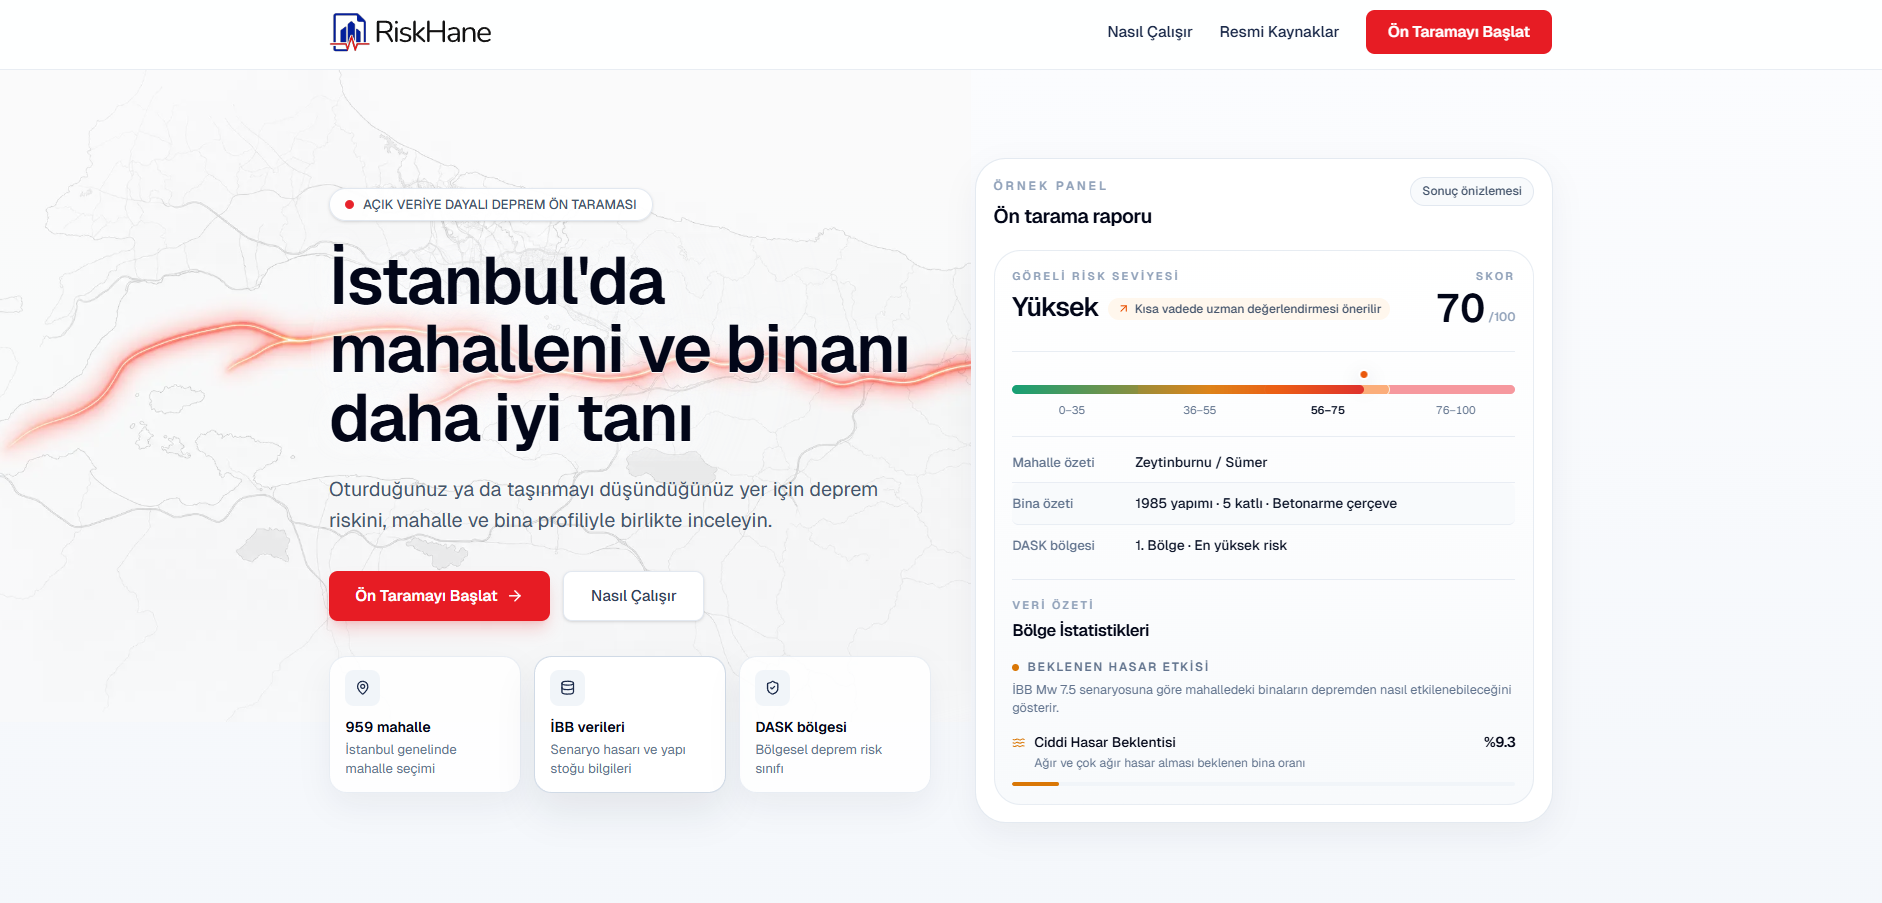
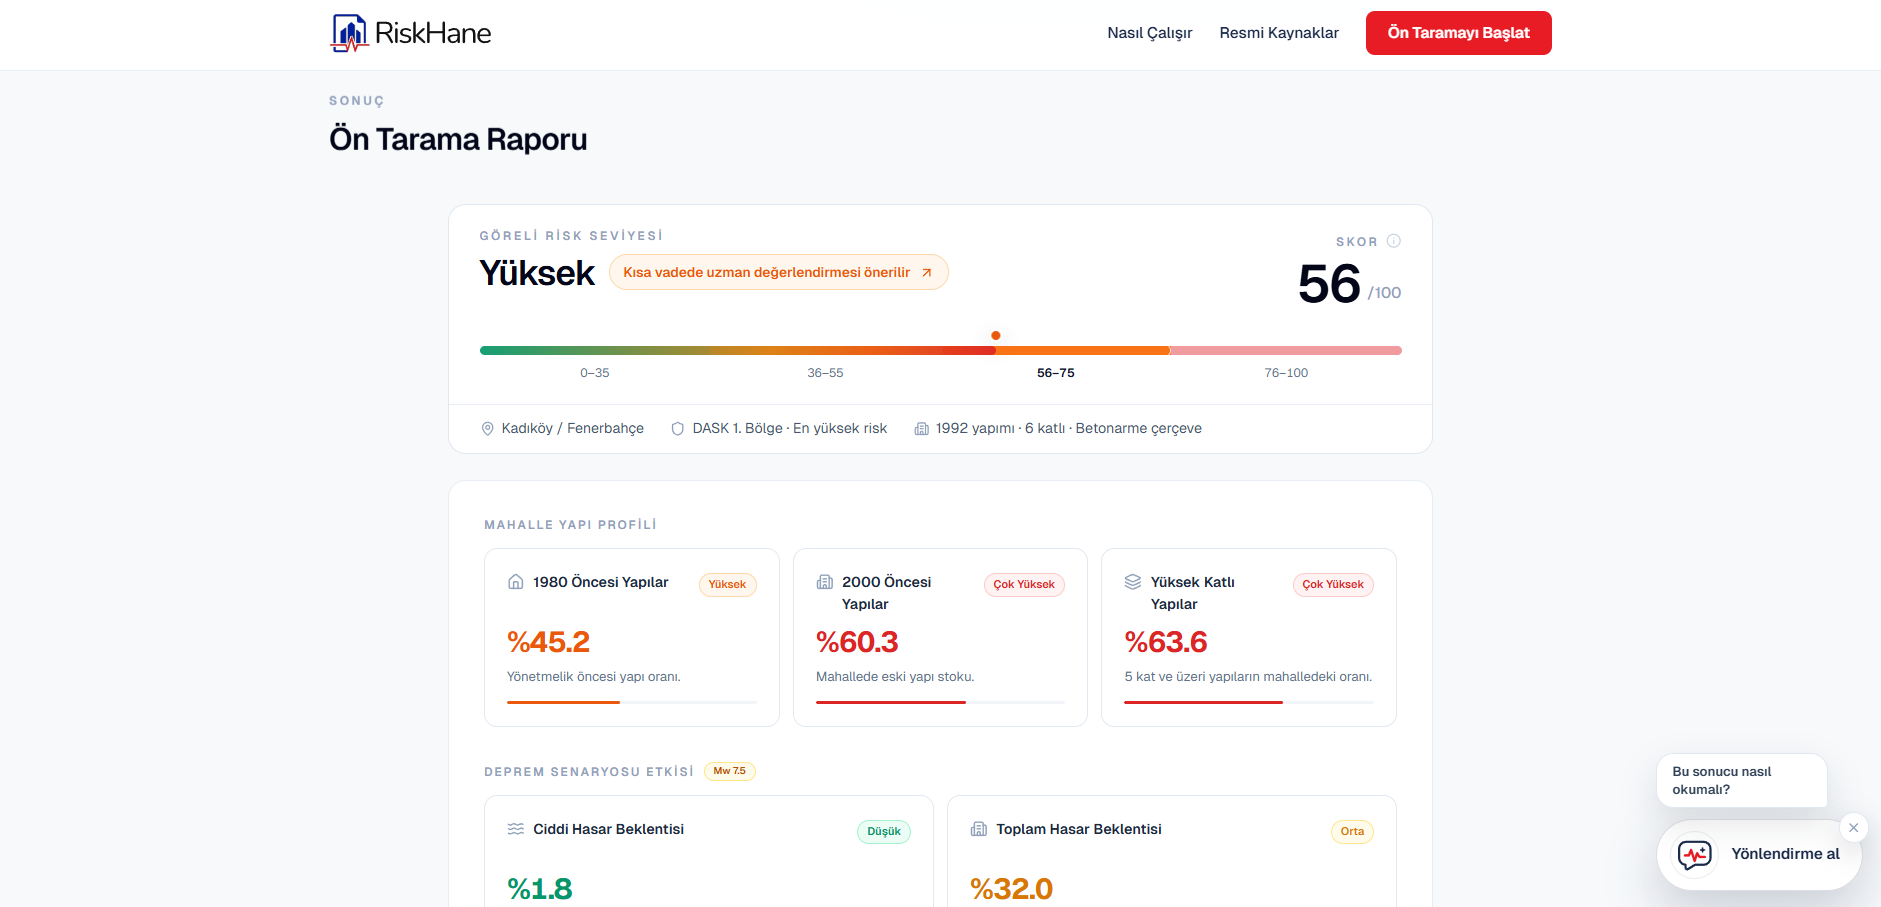
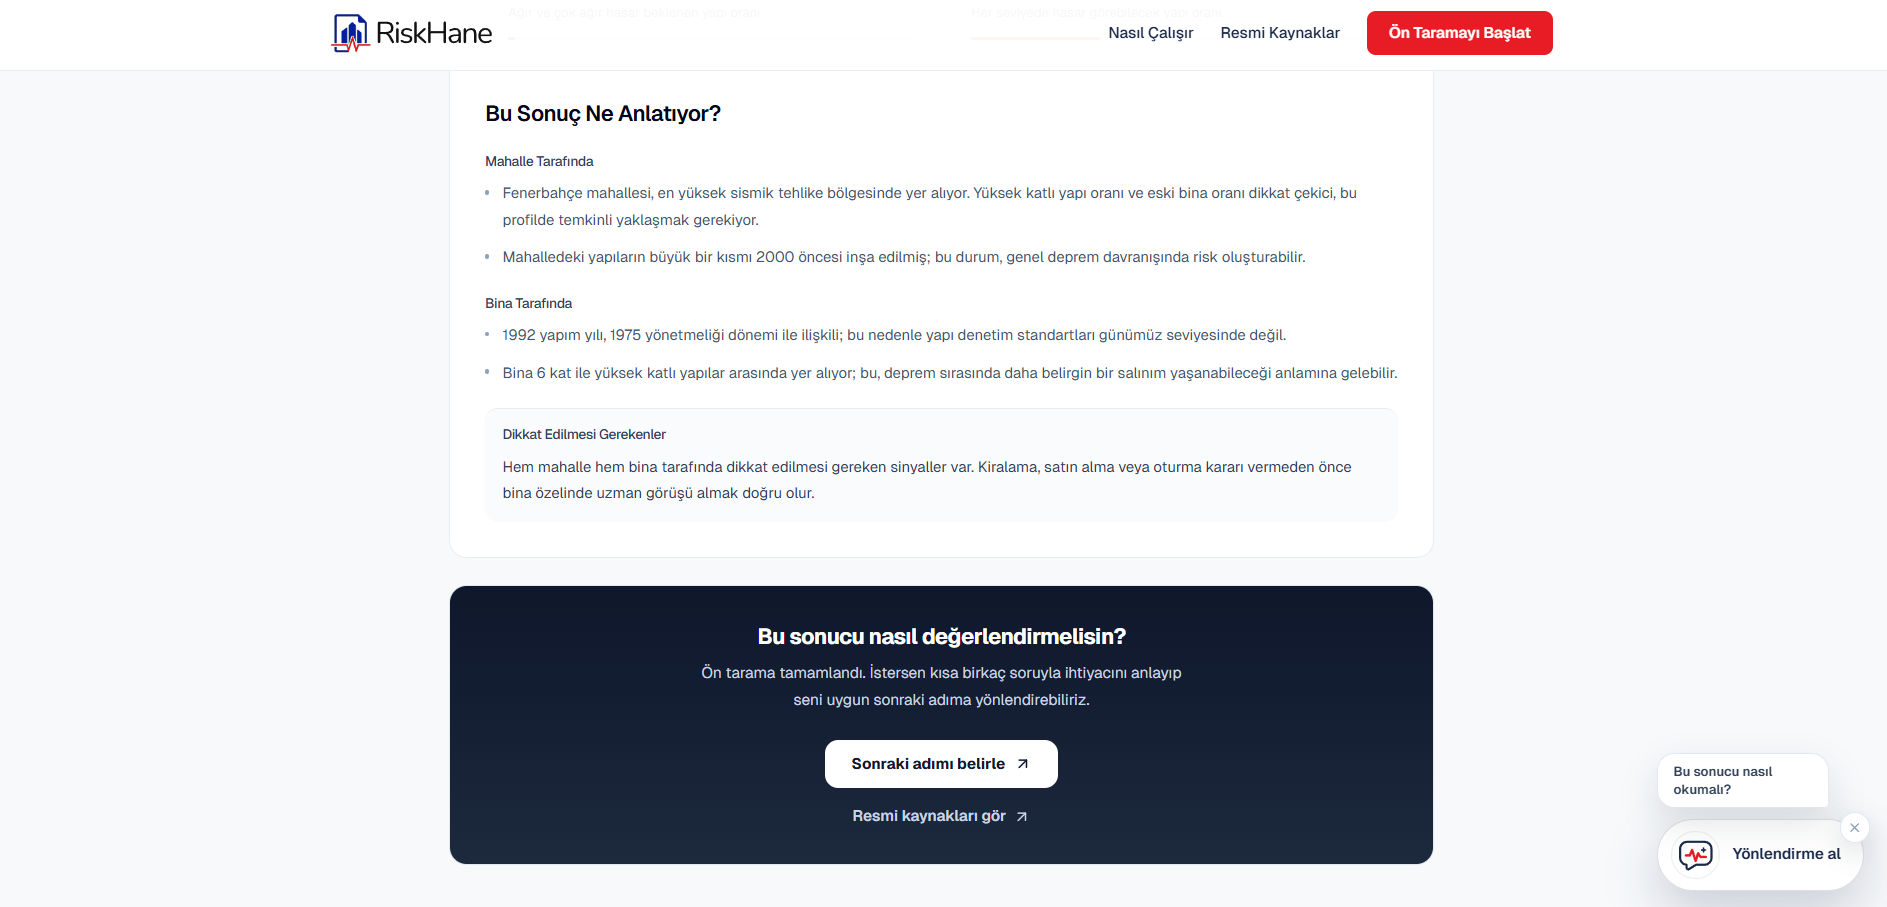
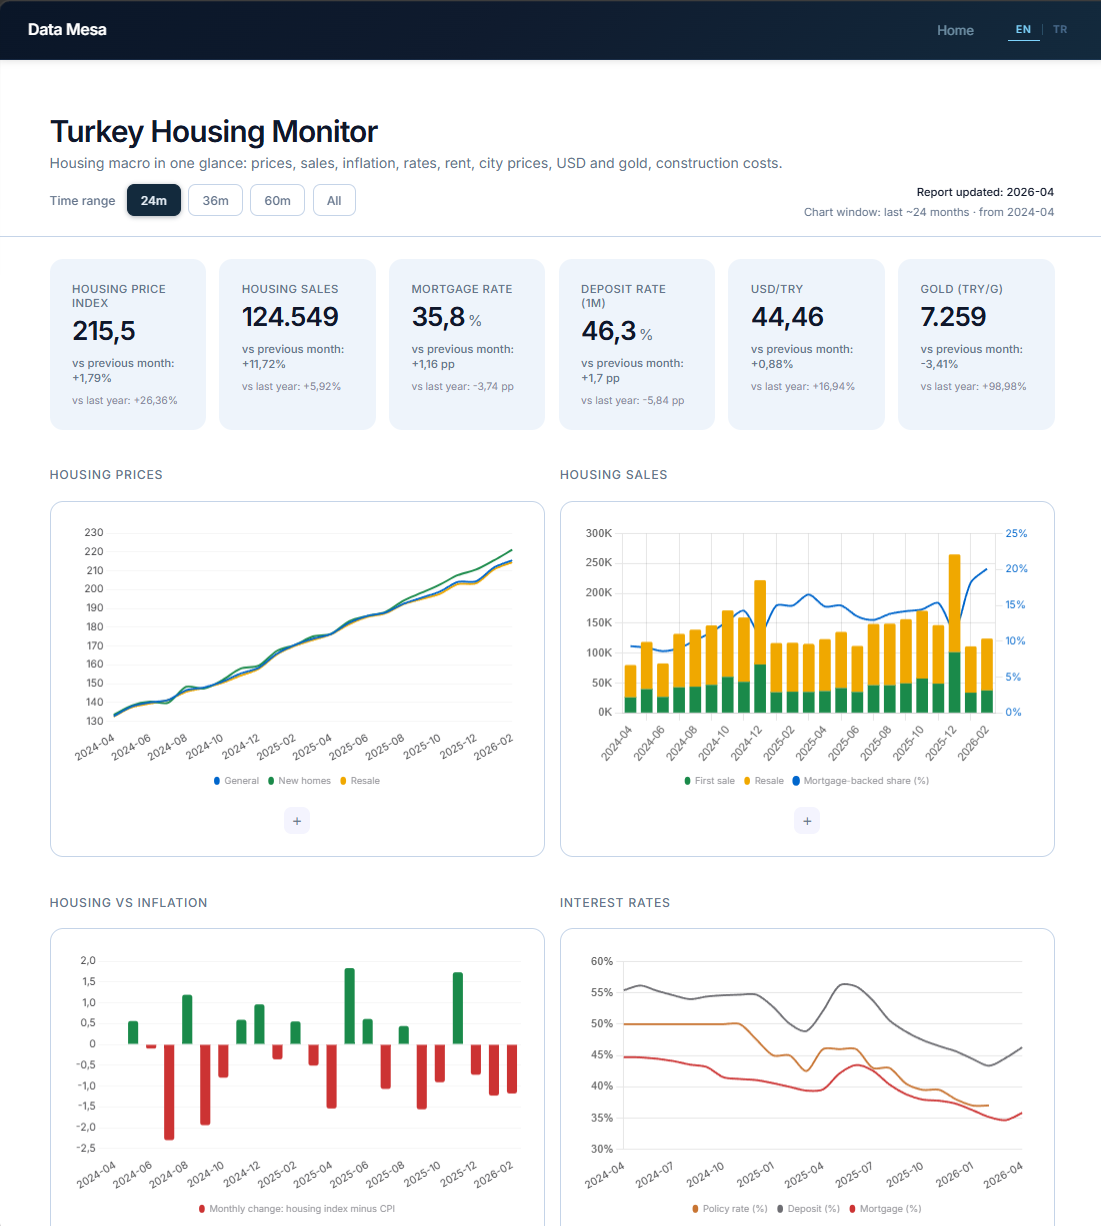
Portfolio

Selected work

RiskHane - Istanbul earthquake risk pre-screening

Decision Support

Problem

Renting, buying or simply living in Istanbul often means making high-stakes housing decisions from fragmented earthquake-risk signals.

Why it mattered

The first decision is not a structural certificate; it is knowing when a neighborhood and building profile deserves expert attention.

Approach

Next.js frontend and FastAPI scoring API combining IBB scenario damage, neighborhood building stock, DASK region and user-entered building features into a relative risk band, score and explanation.

Key insight

The useful product is a responsible triage layer: clear enough for households, careful enough to show source boundaries and uncertainty.

Turkey Housing Market Dashboard

ELT + AI Agent

Problem

Turkey's housing signals — price indices, mortgage rates, rent, FX — are scattered across sources with no unified macro view. In a high-inflation environment, price alone misleads.

Why it mattered

Affordability only becomes readable when multiple indicators move together. The gap between real and nominal spreads is where the actual signal lives.

Approach

Automated ELT pipeline pulling 20 macroeconomic indicators from TCMB's EVDS API into a three-layer Snowflake schema (RAW → STAGING → MART), refreshed monthly via GitHub Actions. A Claude-powered insight agent computes real vs. nominal price spreads and generates buyer / seller / investor signals. Frontend: Chart.js, FastAPI, deployed on Vercel.

Key insight

Automating data ingestion removes the bottleneck — the agent's job becomes interpretation, not collection. Structured signals replace narrative guesswork.

Steam marketplace analytics & forecasting

Business Analytics

Problem

The market is large, but signal is weak—price and performance drivers hide behind noise and uneven data quality.

Why it mattered

Without an honest data layer, forecasts mislead. Weak signals must surface, not disappear, if decisions are to be trusted.

Approach

BigQuery + dbt, Prophet for growth, gradient boosting / RF for price drivers, Live dashboard for exploration.

Key insight

Not all signals deserve attention—Metacritic vs price is weak (r ≈ 0.23). Removing noise is as valuable as modeling signal.

YouTube comment intelligence

Analytics

Problem

Comment threads hold product and sentiment signal; raw text does not scale to product or strategy decisions.

Why it mattered

Without a pipeline and a stable ontology, every analysis reinvents categories—BI and stakeholders never get comparable views over time.

Approach

Ingest via YouTube API into layered BigQuery tables, LLM enrichment for structured attributes, Streamlit for exploration and Live dashboard for reporting.

Key insight

Unstructured comments become useful only when mapped into consistent sentiment and topic signals—repeatable, decision-grade views for creators and sponsors.

GameKit — fast little tools for game night, no app download, just open and play

Product

Problem

Tabletop sessions constantly need dice, coin flips, and similar tools — but downloading a separate app, navigating ads, or carrying physical pieces all break the flow.

Why it mattered

A utility tool should open instantly and disappear into the moment. Friction before the first roll is friction that costs the game.

Approach

Web-based hub — no install, no ads, no account. Four tools in one place: coin flip, classic d6, RPG dice set, and Fate Chamber (AI-powered narrative decision tool on Gemini). React + Vite, ambient audio, deployed on Vercel.

Key insight

Speed and simplicity are the feature — a tool that loads in a second and does exactly one thing earns more trust than a polished app that asks for permissions first.

ThinkSlow — calm focus workspace

Product

Problem

Most focus tools demand attention—features, tracking, and pressure fragment attention further.

Why it mattered

Focus follows environment and cognitive load; without a calm, predictable space, attention destabilizes.

Approach

Ambient-first workspace: minimal UI, controlled sensory input, familiar scenes (rain, night, forest). Next.js, TypeScript, CSS Modules; bilingual UX; Vercel. State stays local—your sessions stay yours.

Key insight

Focus is regulation, not timers—environment shapes attention.

Brazilian e-commerce analytics

Data Analytics

Problem

Public e-commerce data is easy to quote and hard to trust—analysts need clear numbers; leaders need profit context, not adjectives.

Why it mattered

One story, two surfaces: SQL work for rigor, then a small management dashboard anyone can read.

Approach

SQL project: clean joins, headline KPIs (~15.8M BRL revenue, high on-time delivery, ~6% repeat buyers). Dash: satisfaction translated into money on the page.

Key insight

Operations look healthy; loyalty does not—the dashboard's job is to show that gap in plain money terms.